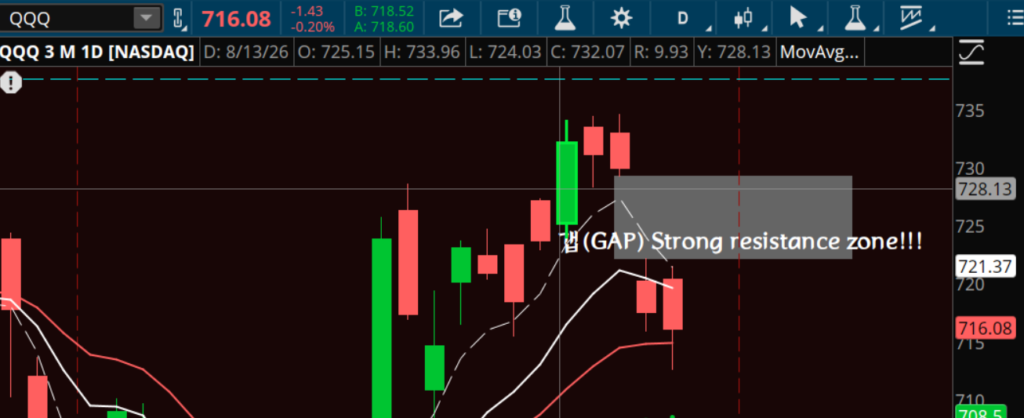
In my recent QQQ long-term strategy post, I mentioned that if the strength of this current rebound looks weak, I would liquidate. To make that call, we need to check whether the gap is being successfully broken or not… But wait, what actually is a gap???
Whenever I look at charts, I realize that a ‘Gap’—the empty space sitting right between prices—is never created just by coincidence.
What on earth is a gap???
It’s simple. A gap is a zone of strong support and resistance. And if you look beneath the surface, that space is essentially a zone where people’s psychological states are intensely compressed.
Overnight, or right as the market opens, all the fierce battles between buyers and sellers in the order book—their hopes, fears, and tug-of-war—are condensed right into that empty space. That is precisely why, when the price eventually returns to that gap zone later on, the market reacts strongly, acting as a powerful pivot point, support, or resistance.
That is why the gap we formed a few days ago is so crucial for us right now. After closely monitoring how QQQ digests this zone, I will organize and share my concrete response strategy soon.
3 Key Types of Gaps in Charts
When assessing market conditions and capturing trading entry points, understanding the nature of a gap is vital. Gaps generally fall into three categories:
1. Common Gap
Characteristics: Typically occurs in thin trading volumes or consolidation ranges without any major leading forces or massive momentum.
Nature: Since it doesn’t carry a huge market shock, it tends to fill relatively quickly (Gap Fill) before long. Rather than reading deep meaning into it, it’s often viewed as a temporary void.
2. Breakaway Gap
Characteristics: Formed when prices break out of a long-term consolidation range or crucial support/resistance line in one swift move, backed by strong volume.
Nature: This serves as a starting flare signaling a brand-new trend or a strong directional shift. A true breakaway gap is rarely filled easily; instead, the level solidifies into a powerful support (or resistance) line and propels the trend forward. (This is most closely related to the zone we are focusing on right now!)
3. Exhaustion Gap
Characteristics: Appears during the final stage of a prolonged bull (or bear) trend when the market reaches an overheated state.
Nature: Because it is created as the energy of buyers (or sellers) flares up for one last time, the trend has a very high probability of abruptly bending or reversing right after this gap occurs. It acts as a warning light signaling that “we’re reaching the very end (exhausted and fading).”
💡 Today’s Thoughts & Principles:
“There is no single home run in life. Go slow and steady, never go all-in!”
By understanding the psychological weight of gaps and properly identifying which type we are dealing with, we can navigate the market with discipline rather than getting swept up by emotions.
I will keep monitoring the market closely and update you with my next steps. Happy trading to all our subscribers!
※ This post is for informational purposes only, and the user assumes all ultimate responsibility for investment decisions.
※ This post contains affiliate links. Purchasing through these links incurs no extra cost to you, and a small commission supports the blog.
※ Prop Firm Discount Guide
※ Get up to 55% off TradeDay via thehttps://www.tradeday.com/?a_aid=NS (If the discount isn’t applied automatically, please type the promo code NS in capital letters at checkout!)